
In the rapidly evolving world of renewable energy and grid modernization, utilities and developers are facing unprecedented challenges. With interconnection requests for large loads, distributed generation, and electrification skyrocketing, the need for efficient, scalable solutions and available capacity transparency has never been greater.
This blog reworks and expands on a poster we presented at RE+ in Las Vegas this September and connects it to our earlier thinking on the FERC Order 2023 and how hosting capacity (HC) maps offer a clearer picture of where capacity exists and provides transparency which ultimately can improve the interconnection process. This post focuses squarely on hosting HC: what it is, how it’s evolving, and why utilities must adopt time-aware, area-wide, and automated approaches now. Our RE+ poster, which laid out an automation workflow using an OpenDSS API (py_dss_interface), informed much of the content of this post.
Where Hosting Capacity Started and Where It’s Going
Traditionally, HC referred to how much distributed generation resources (DERs) a distribution system could accept before it hit a local constraint (voltage, thermal, protection, etc.) or without requiring any network upgrades. Today the term has expanded to include load HC and is even being applied in transmission.
Why the emphasis on load HC now? Well, two main drivers and different scales:
- New large loads are growing fast: data centers are “expected to consume 6.7%-12% of total U.S electricity by 2028”, electrified industrial processes, and fleets of fast-charging EVs are real, concentrated, location specific and often location and behaviorally unpredictable.
- Electrification of everything: heat pumps, light duty electric vehicles, building systems, and appliances with varying rates of adoption have caused an increase in peak demand and a chance in the coincidence of the peaks, making static or single snapshot studies increasingly misleading
HC maps are being more and more broadly adopted. DOE’s U.S. Atlas of Electric Distribution System Hosting Capacity Maps shows a compilation of HC maps from 58 utilities across 26 states.
Transmission vs Distribution Hosting Capacity:
Same Goal, Different Constraints
Transmission and distribution HC assessments differ greatly but ultimately provide the same results, an overview of the grid’s ability to host additional resources or load without infrastructure upgrades.
Transmission HC focuses on system-wide reliability and stability. It evaluates how new resources affect bulk power transfer capability, examines contingency conditions such as N-1 (single outage) and N-1-1 (sequential outages), and considers voltage and stability impacts from large-scale resources or inter-regional transfers as demonstrated in our Case Study. When constraints are identified, mitigation may often requires major system upgrades such as new transmission lines, series capacitors, or static VAR compensators (SVCs), to increase capacity or improve voltage stability.
On the other hand, distribution HC primarily assesses thermal loading and voltage impacts on feeders, though it can also consider protection coordination, reverse power flow, and power quality. Many voltage constraint violations can be mitigated through voltage control and equipment adjustments, such as voltage regulators, capacitor banks or transformer tap changes. In the case of thermal violations, reconductoring may be necessary.
| Category | Transmission (Tx HC) | Distribution (Dx HC) |
|---|---|---|
| Primary Drivers | Large, aggregated injections or withdrawals; long-distance power transfers between regions or balancing areas | Behind-the-meter and feeder-level DERs (e.g., rooftop solar, storage, EVs); customer-side impacts |
| Analytical Focus | System-wide reliability, voltage stability, and transfer capability | Feeder-level voltage and thermal performance, local hosting limits |
| Analytical Timeframe | Often based on specific “snapshot” conditions (e.g., seasonal peak/off-peak, worst-case) | Increasingly uses time-series simulations (e.g., 24-hour, seasonal, or full year) to capture temporal variability |
| Study Objective | Assess how new generation or transfers affect bulk power system operation and contingency response | Evaluate how DERs and loads impact local circuits, voltage regulation, and backfeed conditions |
| Modeling Level | Bulk transmission network (100s–1000s of buses) | Distribution feeders and secondary circuits (individual customers and DERs) |
| Typical Analyses | Power flow under contingencies (N-1, N-1-1), dynamic and voltage stability, transfer limit studies | Steady-state voltage, thermal loading, protection coordination, power quality |
| Constraints Considered | Thermal limits of transmission lines, voltage stability margins, contingency (N-1/N-1-1) reliability, transient stability | Conductor and transformer loading, voltage rise/drop, reverse power flow, unbalance, and protection settings |
| Mitigation Measures | Major infrastructure investments: new transmission lines, series capacitors, FACTS devices (e.g., SVCs), reactive power compensation | Operational or equipment adjustments: regulator settings, capacitor banks, transformer tap changes, reconductoring, new lines |
| Timescale and Impact | Long-term, regional or inter-regional; affects bulk system planning and interconnection queues | Short- to medium-term; affects customer interconnections and local DER integration |
| Regulatory / Operational Interface | Regional Transmission Operators (RTOs) / Independent System Operators (ISOs) | Utilities and distribution operators |
| Representative Example | Evaluating capacity for large wind or solar farms, inter-area transfers, or regional resource sharing | Assessing feeder hosting limits for rooftop PV or electric vehicle adoption |
Distribution Hosting Capacity: Allocation, Conditions and Constraints
When it comes to HC there are many things to consider: allocation, loading condition, limiting constraints, methods, and scale of analysis. The decisions around all of these factors are very dependent on the underlying application. In other words, the type of question needed to be answered would dictate the assumed loading condition and limiting constraints which fundamentally shape the obtained results.
Types of allocations:
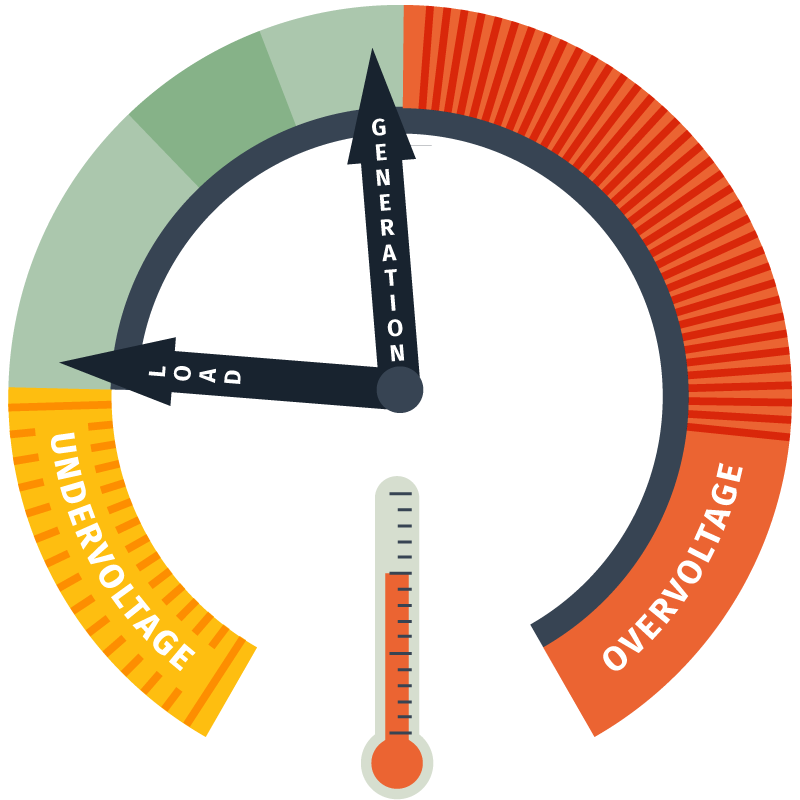
Once the type of allocation is decided, the other decision to be made is the system’s loading condition to study: peak, or off-peak. In the case of DERs, the worst-HC constrained by voltage would be triggered during off-peak hours where generation is highest, causing an over-voltage limited HC. In the case of load, peak conditions would generate the worst-HC which may be thermally or under-voltage constrained.
Limiting constraints to consider:
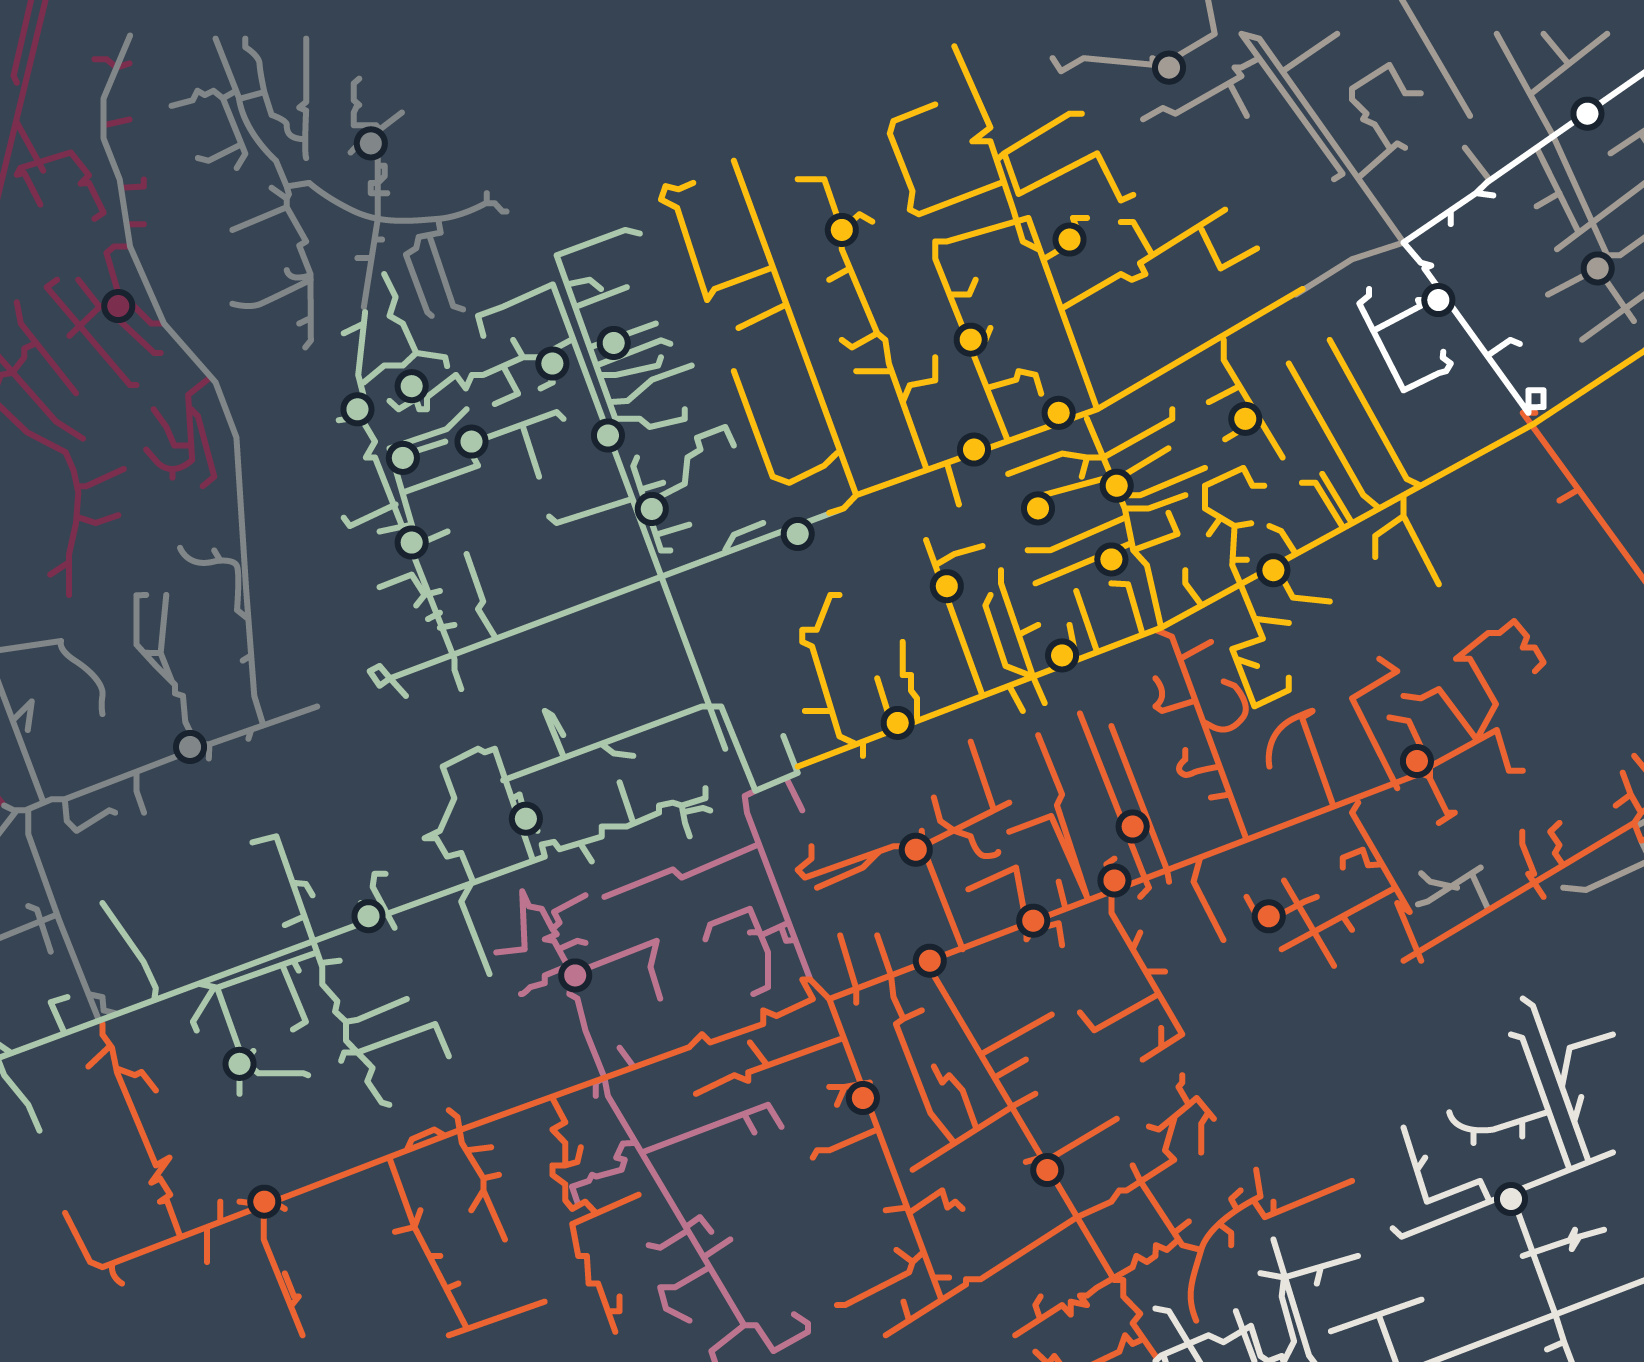
HC considering multiple constraints allows us to visualize how the system is limited.
The available capacity may differ based on limiting constraints selected: voltage, thermal.
This can aid in the mitigation strategy to consider for increased capacity across the system.
Time-series Hosting Capacity (TSHC)
While selection of loading conditions may lead to single results of the worst-case scenario, TSHC allows for the evaluation of the available capacity under various loading conditions and considering the load or generation profiles. Thus, capturing various system and asset conditions:
- Coincidence of load electrification and existing feeder’s load profile
An example of this is transportation electrification: while a bus in the system may not have the available capacity during peak time to host an EV charger on its peak load value, the EV charging profile peak may occur overnight while a residential feeder peak may occur in the early hours of the morning or in the evenings when customers return from work.
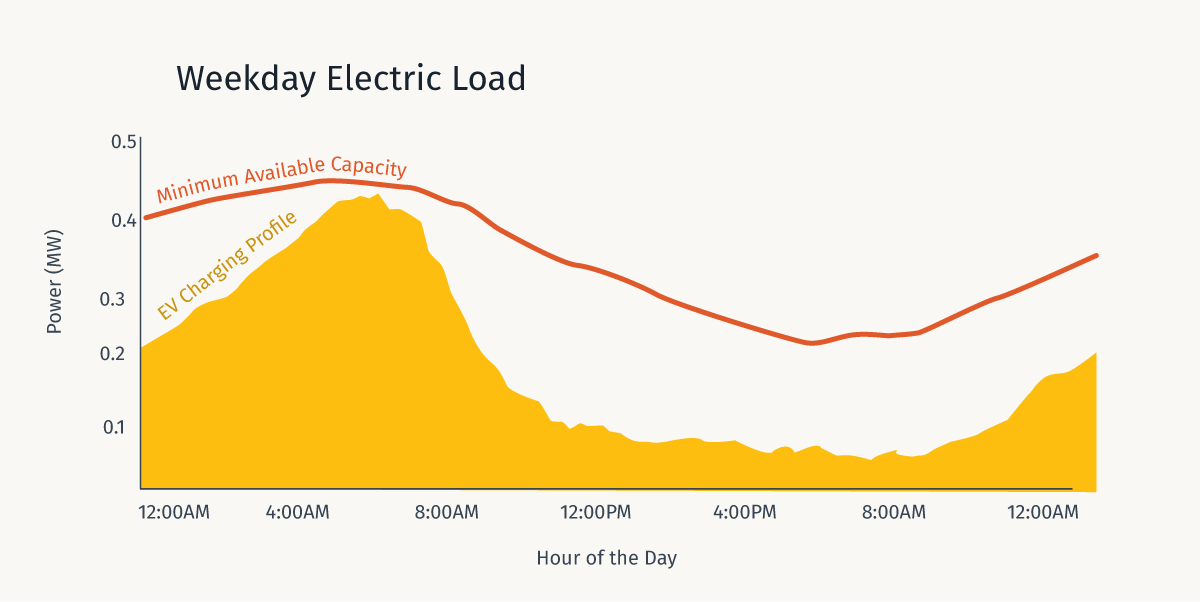
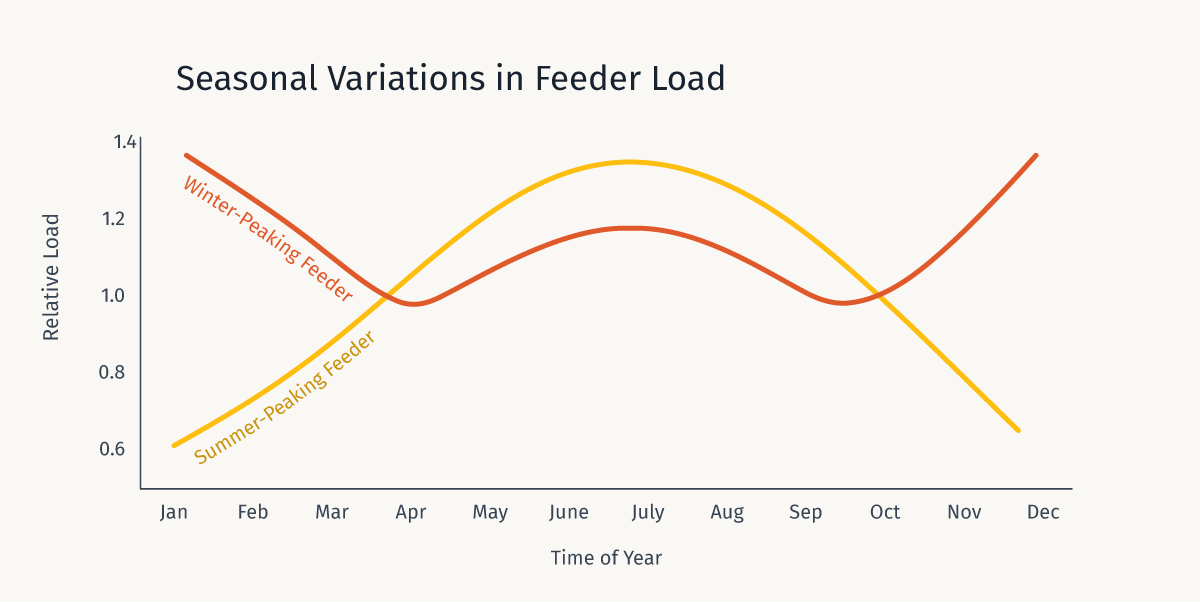
Data sample obtained from DOE’s Electric Vehicle Infrastructure Toolbox - Seasonal and diurnal variations
An example of this may be the case of a feeder normally peaking in the summer but if one is evaluating the electrification of heating, the heating load peak would occur in the winter when the system is experiencing lighter loads.
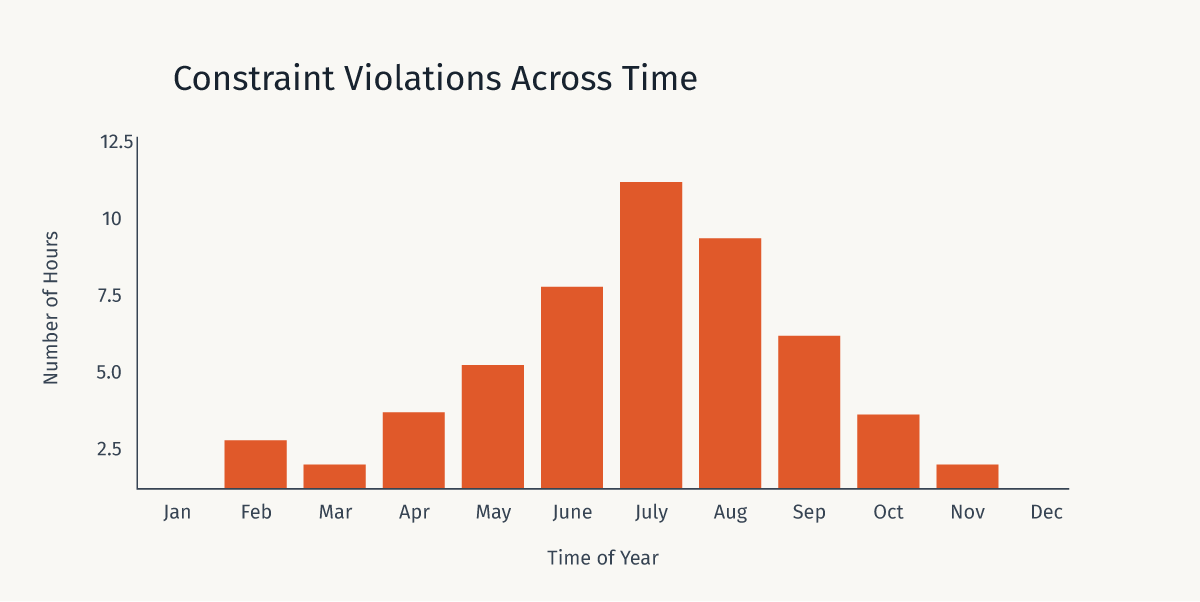
- Constraint violations across time
Looking at constraint violations over time allows for the analysis of the number of times a constraint is hit throughout the year. Which may be a metric that triggers various mitigation measures.
TSHC has many benefits from revealing when the system is truly constrained (not just theoretical worst-case scenario), enabling targeted mitigation, to improving the accuracy for planning efforts considering time-dependent demand and generation. Lastly, it supports operational planning that can shift or shave peaks, thus increasing HC by coordinating storage dispatch and demand response.
Data Validation: The Unsung Prerequisite
HC results are only useful and as reliable as their input. The “Data Validation for Hosting Capacity Analysis” report by IREC and NREL underscores common data pitfalls such as model errors (missing or mislabeled conductor types or phases, incorrect regulator settings and transformer configurations, mesh or loops on network topology, etc.) and inaccurate load/generation data (use of estimated customer consumption data instead of actual measurements, data quality issues with measurement data, etc.), highlighting the need for model maintenance and quality control. Recommendations of best practices are provided to obtain successful and reliable HC maps. Typical recommended validation steps include:
- topology and connectivity checks (are devices where the model says they are?),
- meter-to-model load shape reconciliation,
- equipment nameplate and impedance verification (transformers, conductors)
- switchable device and regulator tap behavior validation, and
- anomaly detection and outlier handling for SCADA and AMI data.
Without structured data validation, HCA results quickly become noisy and non-actionable. In short: validate first, analyze second.
Automation and Open-source Tools
The computational complexity of conducting HC maps across an entire grid, especially with the detailed, time-series approach, is enormous. This is why automation and advanced tools are non-negotiable.
Open, scriptable tools have dramatically lowered the barrier to comprehensive HCA. Coupled with open source libraries like py_dss_interface engineers can now rapidly execute multiple study scenarios and accelerate analysis workflows. This accessibility aligns with and builds upon the foundational work done by organizations like EPRI in developing HCA methodologies.

Automation and parallel execution are practical steps to scale HCA across feeders and larger areas. By embracing modern tools and a commitment to data validation, utilities and developers can finally crack the grid code, transforming the interconnection process from a painful bottleneck into a transparent, predictable, and scalable engine for the clean energy transition.
But what does this look like in practice? Our next post on HC will show you how we implemented parallelization and automation of HCA for a large area, the available DER HC considering voltage and thermal constraints and its computational performance.
In the meantime, if you publish HC maps or plan to, reach out to us or leave a comment. We can share our parallelization and validation playbook.
Loved the article? Hated it? Didn’t even read it?
We’d love to hear from you.

This is a fascinating and thorough exploration of the evolution and technical considerations for hosting capacity analysis. The emphasis on time-aware, automated approaches and the critical role of data validation really resonates. It makes me wonder how these principles of integrating disparate, time-series data and ensuring its trustworthiness for high-stakes decision-making translate to other complex fields.
For instance, in pharmaceutical R&D, a similar challenge exists with siloed biological, chemical, and clinical data. I recently read a practical guide on using Linked Open Data to unlock drug discovery at https://prismforum.org/unlocking-drug-discovery-a-practical-guide-to-linked-open-data, which advocates for a connected, URI-based approach to build a ‘knowledge graph’ much like your time-aware hosting capacity map.
Given your expertise in building scalable, trustworthy systems for the energy sector, have you considered if any of the data validation frameworks or parallelization techniques you’ve developed could be applied to other domains dealing with complex, interconnected data and ‘YMYL’ (Your Money or Your Life) decisions, such as healthcare or drug discovery? The parallels in needing to automate the integration of validated data from authoritative sources to accelerate critical processes seem quite strong.
Thank you for your thoughtful and insightful comment. Data quality and validation are universal challenges across any industry that depends on complex and distributed data ecosystems. Whether it’s grid modeling or drug discovery, the integrity and consistency of data directly influences high-stakes decisions.
In the energy domain, the Common Information Model (CIM) provides a standardized framework for representing, exchanging and integrating information about power system components and their relationships across different applications. In my opinion, CIM is more aligned to the philosophy behind Linked Open Drug Data both aiming to create a connected, interoperable systems that make complex information more accessible and meaningful. (You might enjoy our related post on CIM: https://www.simplethread.com/speaking-in-cim-the-26-year-old-language-of-the-power-grid/)
While I have not personally explored applying these frameworks or parallelization techniques beyond the energy sector, I think the principals could certainly be adapted to healthcare and pharmaceutical contexts. Ultimately, whether modeling the electric grid or human biology, the core challenge and opportunity lie in building frameworks that make data not only interoperable but also trustworthy and actionable.