

Introduction: A Closer Look at Software Solutions for Generation Interconnection Studies
As discussed in our previous article on The Clean Energy Transition: Generation Interconnection Explained, injection studies stand as a pivotal component of the GI process. In that installment, we delved into the objectives of these studies and some of the associated challenges. Now, in this post, our focus shifts to the tools and software solutions that can effectively surmount these challenges. Our exploration will entail an assessment of these tools, taking into account their functionalities, intended applications, and any inherent limitations. The optimal tool should not only empower stakeholders in this intricate process but also facilitate confident decision-making. Moreover, it should offer a streamlined approach to interpreting results, sparing stakeholders from drowning in a sea of numerical data.
GI Developer Objectives in POI Selection
In the complex landscape of GI, a multitude of stakeholders holds diverse objectives regarding the outcomes of injection studies. For the purpose of this discussion, our focus narrows to project developers, who harbor a distinct primary goal: identifying the optimal Point of Interconnection (POI) for their generation projects. While optimization can manifest in various forms, we’ll proceed with the assumption that the central aim revolves around cost reduction – specifically, minimizing or even circumventing network upgrade expenses to trim the project’s overall financial outlay.
As a result, the selected tool should have the capability to survey a geographical area and present a spectrum of potential POIs. When we refer to “survey,” we mean the tool’s capacity to rapidly conduct these studies for potential POIs and subsequently sifting through the results to identify the most promising ones. It’s evident that a pivotal feature of such a tool is its ability to conduct injection studies at scale. This raises considerations such as the availability of computational resources, data accessibility, and the tool’s ability to parse and summarize study results.
Balancing Precision and Scalability
Naturally, the quality of results generated by this tool hinges on the assumptions it employs during the study process. For instance, if it exclusively relies on the default power system model supplied by the transmission operator without any adjustments, the results might underestimate the transmission network’s potential capacity. Conversely, if we desire the tool to make more realistic assumptions and consequently modify the baseline model, we introduce additional complexity, rendering the creation of such a tool more challenging. Moreover, this added complexity is likely to amplify the computational costs of the studies and necessitate more resources.
Therefore, the crux lies in achieving a delicate balance between the tool’s precision and scalability. To strike this balance effectively, it is imperative to first comprehend the user’s objectives and evaluate the risk-reward trade-offs associated with making decisions based on the tool’s findings.
Existing Tools
Let’s explore some of the existing tools and software solutions. First, we’ll start with some examples of publicly available tools.
Publicly Available Tools
Queue Scope is a tool provided by PJM to offer insights into grid congestion at specific points of interconnection, benefiting interconnection customers and other stakeholders. It’s important to note that this tool has a specific purpose and is not intended to replace the official interconnection studies conducted by PJM during their formal interconnection process.
The tool’s disclaimer emphasizes that the results presented in Queue Scope are not indicative of real-time system conditions. They may not encompass all the assumptions and considerations typically examined in comprehensive interconnection studies. While the disclaimer doesn’t specify the exact system conditions and study assumptions in question, it likely refers to factors like changes in the GI queue, existing projects within the queue, and long-term transmission expansion plans that could impact the grid’s topology and capacity.
Furthermore, Queue Scope primarily focuses on thermal constraints within the system, omitting factors like voltage, stability, or short-circuit constraints. In essence, it provides an estimate of the megawatt (MW) impact a proposed generation project may have at a designated point of interconnection. This estimation relies on pre-calculated distribution factors (DFax).
Distribution factors, denoted as DFax, express the proportion of injected current or power at a specific point that traverses through various paths in the network, such as transmission lines or transformers. Typically represented as percentages, these factors can be computed using network topology data and electrical parameters like impedances, admittances, and tap ratios.
It’s worth noting that the tool’s selection of points of interconnection (POIs) is restricted to substations or, more precisely, buses in the transmission model. Unfortunately, there isn’t an option to select a specific point along a transmission line for analysis.
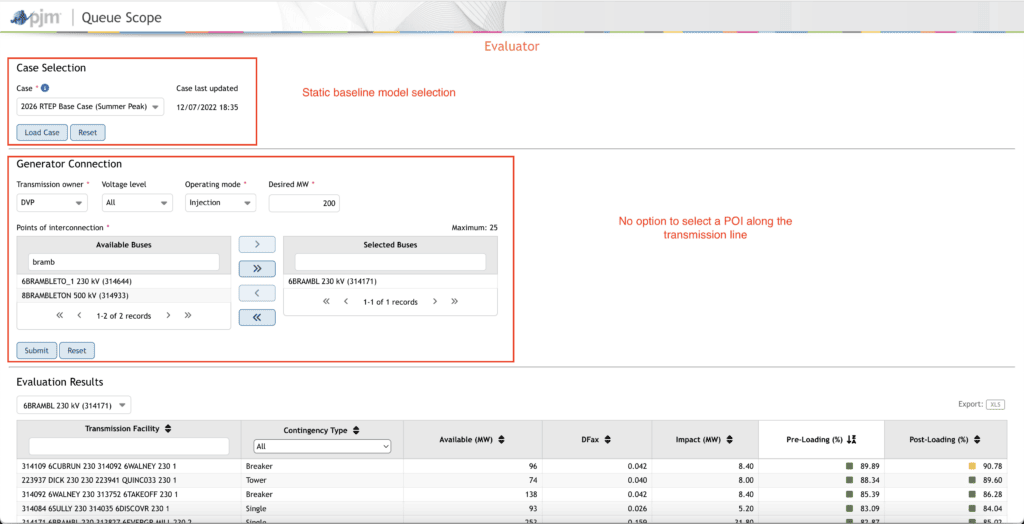
Furthermore, it appears that the results rely on a static power flow model, and there is a high likelihood that no real-time analysis occurs when users modify their selected points of interconnection (POIs). Consequently, when assessing the tool, it essentially provides an estimate of the current transmission congestion within PJM’s footprint. However, this estimation is contingent on a very specific set of assumptions and a snapshot of the continuously evolving GI queue and the landscape of transmission expansion plans. These factors could potentially impact the available transmission capacity. Subsequently, the tool leaves it to users to gauge the extent to which these results prove valuable in their decision-making processes concerning project siting and the potential costs associated with network upgrades for such projects.
MISO’s Points of Interconnection Tool
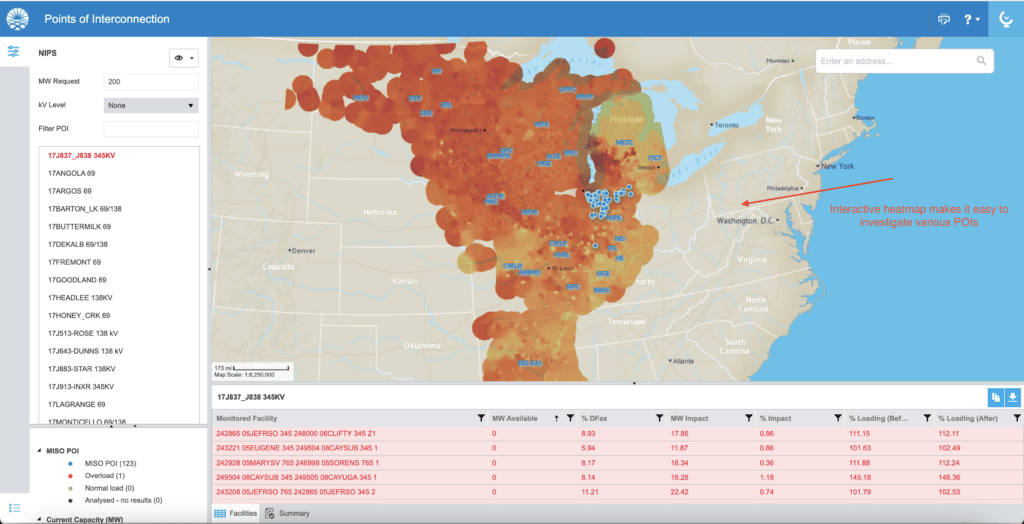
MISO’s Points of Interconnection tool is strikingly similar to PJM’s Queue Scope in terms of what it offers and its limitations. Like PJM’s tool, it serves as a general guideline for identifying congested areas but doesn’t account for all system conditions and constraints.
One notable difference is the presence of a map in MISO’s tool, displaying a heatmap of available transmission capacity across their footprint. This feature arguably makes the tool more useful in identifying potentially viable points of interconnection by adding a visual element to the tool. However, users are still limited to selecting from a list of existing substations, with no option to examine injection capacity along specific transmission lines.
Similarly, users must specify the potential size of their project in MW before any results can be calculated. The reporting mechanism is akin to PJM’s tool, with the MW impact calculated based on predetermined DFax values for all monitored facilities at a given point of interconnection.
In summary, both tools have their strengths and limitations, providing estimates of grid congestion within specific regions but not accounting for all factors affecting system reliability and performance. MISO’s tool gains a slight edge with its visual map element, offering a more user-friendly interface for identifying potential points of interconnection. However, the ultimate utility of these tools depends on how well they align with renewable developers’ decision-making processes and network upgrade cost considerations.
Off-The-Shelf Solutions
Now, let’s take a look at an example of a commercial tool designed to assist developers in their site selection endeavors.
In contrast to PJM and MISO’s free tools, Nira is a paid service/product that boldly advertises “Injection studies at every Point of Interconnection (POI)” on its landing page. As of the time of writing this post, there was no demo version readily available on their website; instead, users are required to request a demo. However, based on the information provided on their site, Nira appears to be a map-based injection study tool claiming comprehensive coverage across major market regions such as MISO, SPP, PJM, CAISO, and more. Per their FAQ section, Nira retrieves the power flow model from each Independent System Operator (ISO) and conducts injection studies at each substation. Nonetheless, it remains unclear whether they refine the ISO-supplied model for a more balanced and realistic representation of the GI landscape or employ the baseline model without adjustments. Nira also asserts that they routinely update study results to align with changes in the queue.
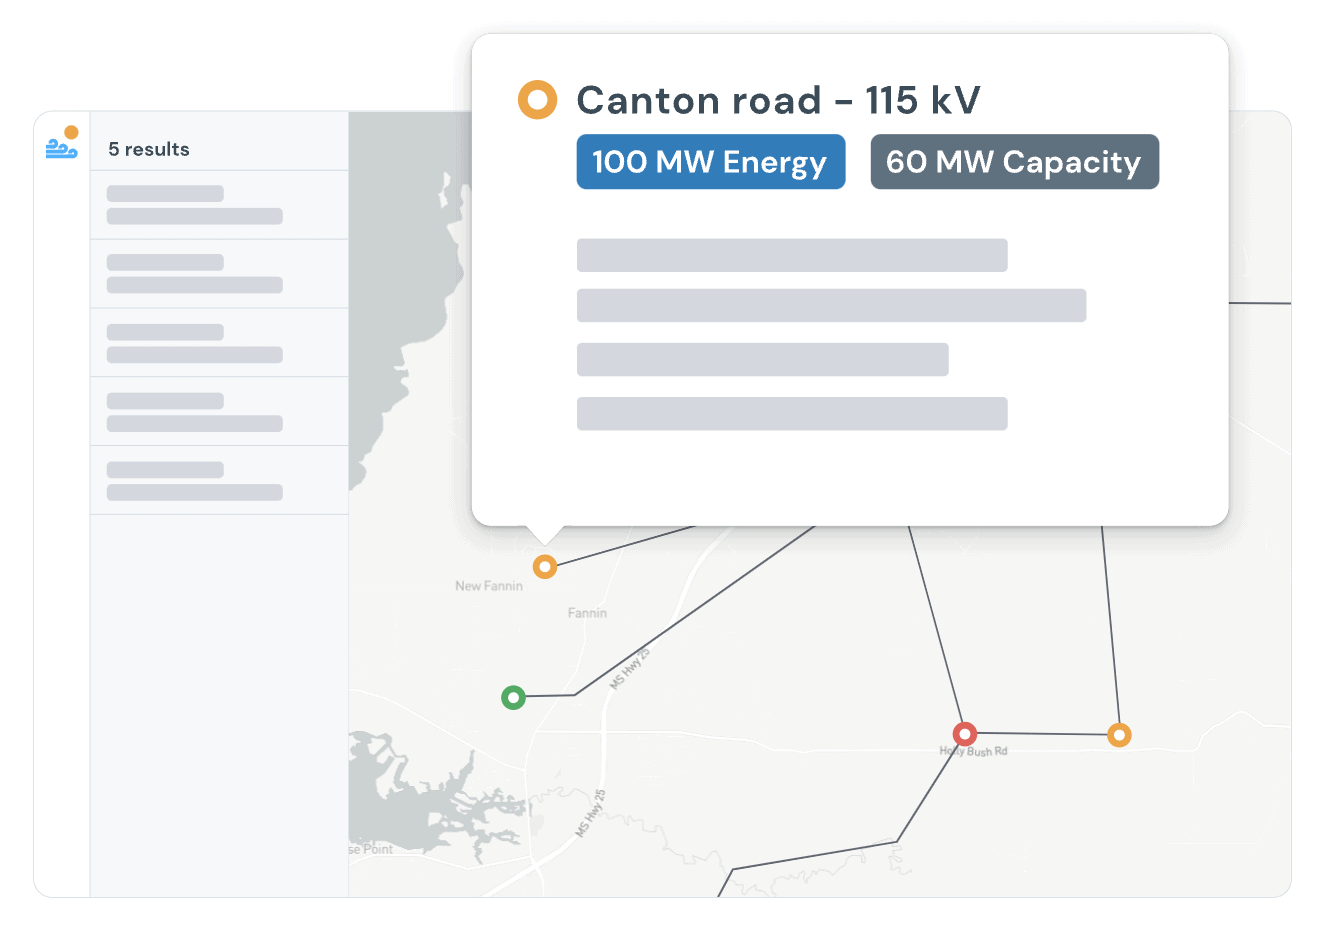
While a comprehensive assessment of the tool requires a more in-depth evaluation, information available on their website suggests that Nira likely represents an enhanced iteration of publicly available tools, offering the added benefit of continuous result updates.
Conclusion
In this exploration of tools and software solutions for injection studies in the generation interconnection (GI) process, we’ve investigated both publicly available tools and commercial offerings. As we wrap up this discussion, let’s extract the key takeaways:
- Diverse Stakeholder Objectives: Within the intricate GI landscape, various stakeholders have distinct objectives. For project developers, cost optimization often takes center stage, emphasizing the need to pinpoint the optimal Point of Interconnection (POI) to minimize network upgrade expenses.
- Balancing Precision and Scalability: The heart of the matter lies in striking a delicate balance between the precision of the tools used and their scalability. Tools must cater to the user’s objectives while considering the trade-offs associated with decision-making based on their findings.
- Publicly Available Tools: PJM’s Queue Scope and MISO’s Points of Interconnection Tool offer valuable insights into grid congestion within specific regions. However, they come with inherent limitations, such as relying on specific assumptions and not accounting for all factors affecting system reliability.
- Commercial Solution: Nira Energy offers a commercial solution with a comprehensive coverage across major market regions. While it claims to conduct injection studies at each substation, the details regarding model refinement and adjustments remain unclear without an in-depth evaluation.
In this ever-evolving landscape of generation interconnection, selecting the appropriate tool is crucial. Stakeholders must thoroughly assess the tools’ suitability for their goals, their capacity to offer practical insights, and their adaptability to the changing GI environment. Efficiency and precision in software tools are essential for the transition to green energy. We’ll continue this journey by exploring how a customized version of a generation interconnection study tool can empower stakeholders to more confidently navigate this complex and uncertain field through large-scale, scenario-based studies.
Loved the article? Hated it? Didn’t even read it?
We’d love to hear from you.


Hi Hadi, did you consider Pearl Street or NextEra 360? Would you be open to a call to discuss the various options and the future of injection studies for developers?