
Before we talk about how software prevents blackouts, let’s talk about how software can cause blackouts.
On August 14th, 2003, the midwestern and northeastern United States, as well as most of Ontario, experienced a power outage. At the time this was the most extensive power outage ever recorded, affecting somewhere around 55 million people, and it still stands as the most widespread power outage in the USA’s history. Homes and businesses were without power for some amount of time ranging between 2 hours and 4 days (depending on which section of the grid they were on).
Besides the obvious effects of a power outage (no lights, no refrigeration), there were also many other further-reaching effects. The water supply in many cities lost pressure due to the blackout, leading to boil-water advisories. Cell phone usage was so high that mobile networks became overloaded. All this to say, the power outage was a big deal.
So how did it happen?
When an event like this happens on this scale, a lot of research goes into figuring out how everything played out, and how to prevent a similar event in the future. And sometimes, a case study is released. If you’re a glutton for 238 page case studies, you can find that here. (Practical Engineering has a great video on this particular blackout, and this case study).
And as the power industry and regulatory groups began conducting their research, they started to build a timeline of events. And what was the first event on that timeline?
A minor software bug.
August 14th
So, consider the scene—it’s a warm summer day. Some people are out and about, enjoying the summer sun, while many other folks are hanging out indoors, using their air conditioning to keep their homes and businesses nice and cool.
Let’s stop here for a moment.
What a feat of modern engineering air conditioning is! We might even take it for granted some times.
You know who doesn’t take air conditioning for granted? Grid operators. The people involved in grid management are intimately aware of the supply and demand of power.
Every day power consumption rises and falls, as consumers turn on and off their different devices and utilities. This power consumption tends to be pretty predictable. As a general rule, people use more power during the day, and less at night.
Another general rule is that power consumption is higher during more extreme weather. In very cold temperatures, energy usage will rise as more people stay indoors, and some people heat their homes with heat pumps or electric furnaces. But where we see the highest energy consumption is during extreme heat, when many homes are running their air conditioners.
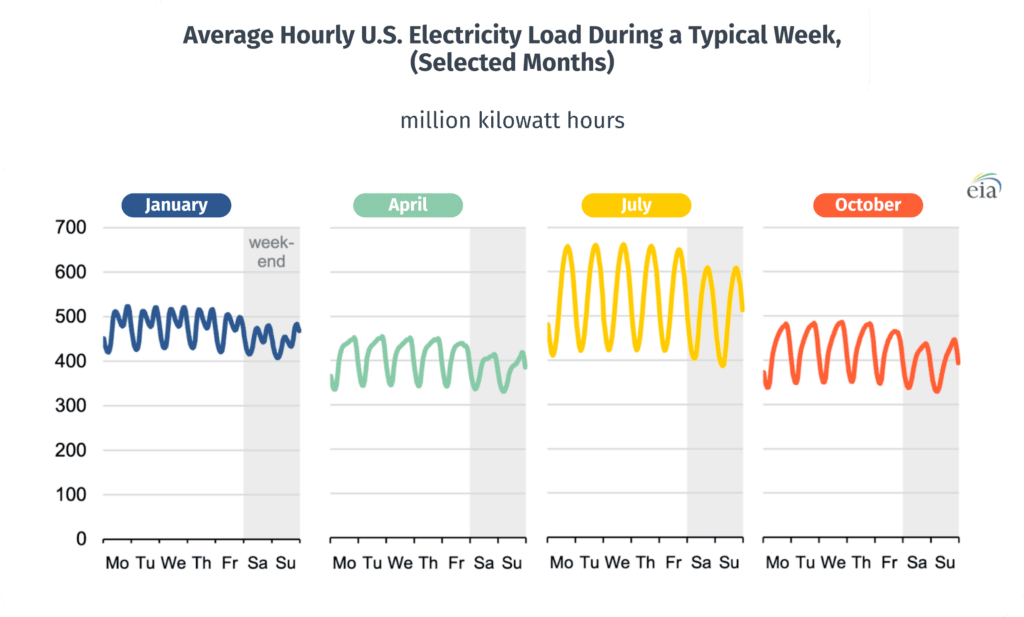
(https://www.eia.gov/todayinenergy/detail.php?id=42915)
In the graphs above, we can see that both of these trends are demonstrated. First, the daily rise and fall of energy usage, and secondly, the higher usage in the warmest displayed month, July.
Grid operators and reliability coordinators need to take these trends into consideration. Their job is to make sure that the grid is functioning properly, and is able to meet the demand of its users. And, on a warm summer day, power consumption is going to increase, and they need to generate enough power and be able to deliver to those homes, and to all of those air conditioners.
In addition to the warm day, MISO (Midwest Independent Transmission System Operator) had some power plants which were out-of-service. However, they took both the high temperatures and the out-of-service generators into consideration, and according to their best estimates and forecasts they understood that the grid would still be able to operate within normal limits.
And now, with the stage set, we return to our fateful day of August 14th.
12:15 PM
To understand what happened next, we need to know what went wrong in the control room.
Grid operators, like MISO, will model the grid and interpret raw data from the grid in real time by using a “state estimator”. This is a powerful piece of software which grid operators and reliability coordinators rely on to, well, estimate the state of the grid.
They will then take the state of the grid, and feed it into another piece of software, known as a Real-Time Contingency Analysis (RTCA) tool. They use the RTCA tool to look at the grid and say, “Would the grid be stable if this transmission line went down? What about this transformer?”, as well as hundreds, or thousands of other scenarios.
The day started normally, but at 12:15 pm, MISO’s state estimator was experiencing some strange issues. It couldn’t seem to solve the power flow equation. It couldn’t “converge”, as they say. (The term “converge” in this context refers to the process of finding a solution to the state estimation problem that is consistent with the measured data. Getting into the weeds here, but there’s basically an iterative algorithm which needs to repeatedly refine its estimate of the system state, and it is unable to approach an answer.)
Why was this happening?
Well, twice that day, a transmission line which was outside of MISO’s region had been taken offline. A tree had fallen over and had caused a fault. This isn’t ideal, but… it’s also pretty normal. Unplanned outages and faults are fairly common, and though you can’t plan for them, a lot of work goes into making the grid robust enough to handle such an event. In fact, that’s exactly what the state estimator and the RTCA software are for!
However, MISO’s state estimator didn’t have a reference to that transmission line data, and so when the data was coming in, it didn’t know what to do with it. It didn’t make any sense.
And so the transmission line data had to be entered manually. Doing this required a lot of live troubleshooting, manual work, and a lot of phone calls. The state estimator was for all intents and purposes offline.
This also meant that, without any snapshot of the grid, the Real-Time Contingency Analysis (RTCA) tool was also offline.
1:31 PM
Since the software was unavailable, partly because it wasn’t robust enough and required manual entry for some time that day, MISO was unable to foresee the vulnerabilities in their part of the grid.
Meanwhile, as MISO’s software struggled, FirstEnergy, an operator in northern Ohio, was struggling to generate enough power. Specifically, and this gets a little technical, they couldn’t generate enough reactive power, which is a type of power required by induction motors. And what machines happen to commonly use induction motors? That’s right, air conditioners.
So FirstEnergy was importing lots of energy, and they were pushing their power plants to the limit in order to meet demand. They pushed a bit too far, and Eastlake 5, one of their most important power generating facilities, trips offline. This meant they had to import even more power, and carry even more power across their transmission lines.
Then, around 2:15pm, something else happened. FirstEnergy’s alarms failed. That’s right, another computer failure! Their alarm was meant to warn them when their equipment was experiencing issues. And this system which was meant to alarm grid operators in the control room was stuck in an infinite loop. An infinite loop!
Let’s stop and zoom out a bit here. More and more events transpired from this point, transmission lines were overheated, lines sagged, breakers tripped, power was rerouted, FirstEnergy and MISO were caught off-guard due to the software bugs, cascading failures ensued, and the rest is history.
It’s Not Just About Software
August 14th was a mostly mundane, average day. It was hot, but not too hot. There were faults on transmission lines, but faults are to be expected. However, the series of compounding, seemingly innocuous events eventually led to a massive power outage.
What could software have done?
I’ll start by saying that better software could have prevented this event. There, I said it!
Had the state estimator tool been built to interpret the transmission line outages outside of the MISO range, or for instance, if it had been able to communicate with a neighboring state estimator, then MISO would have been able to run real-time contingencies and see how vulnerable the grid was in northern Ohio.
Had an infinite loop been avoided, FirstEnergy would have been able to warn neighboring grid engineers of the local instabilities, and their electrical grid neighbors could have coordinated a better solution.
That being said, software is not the silver bullet to end all of the grid’s problems.
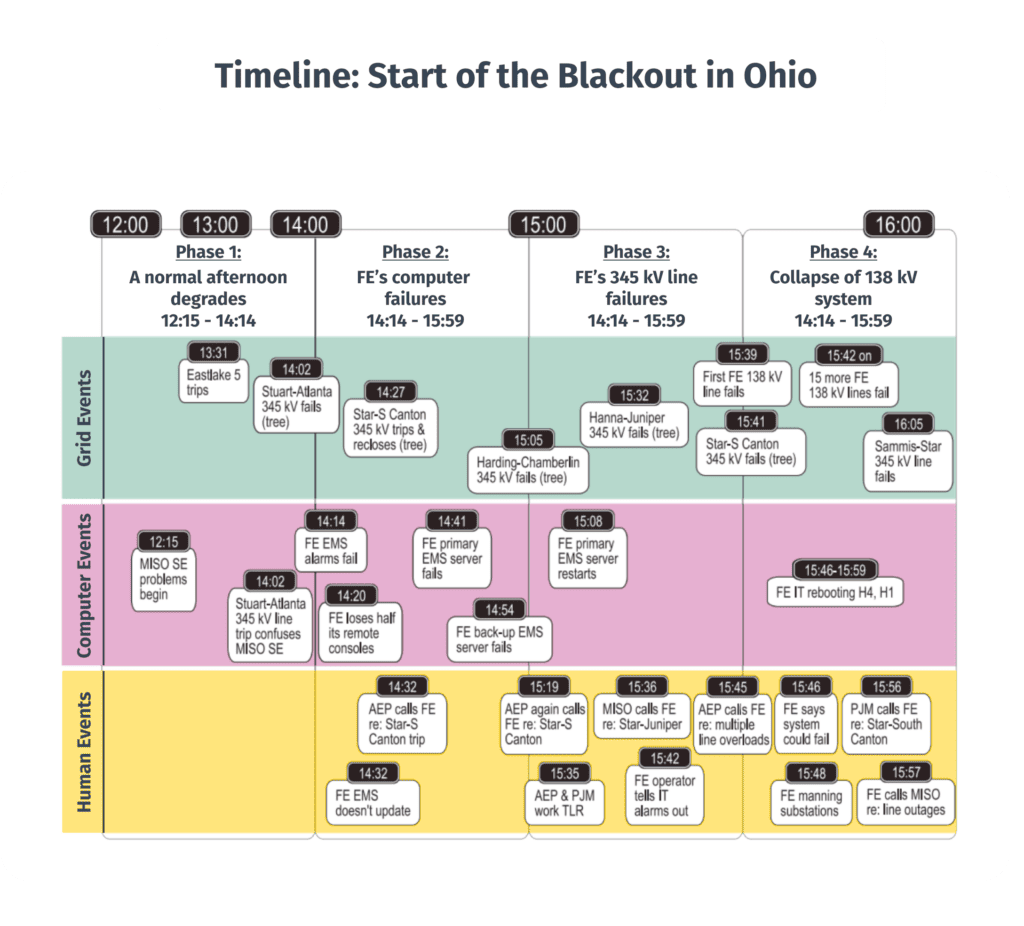
(Source—The 2003 Case Study—a timeline comparison of all the important events that led to the blackout, broken up into human faults, computer faults, and grid faults.)
If we take a look at this timeline, we can see some of the events we’ve discussed so far, like the MISO State Estimator (SE) problems. We can see that there are “computer events”, but there are also human, and grid events. I want to focus on some of those other details for a bit.
For example, sagging is a common way faults happen. Hot temperatures make power lines sag, the hotter a line is, the less efficiently it carries electricity, and the hotter it gets, heat makes metal expand, the lines sag more, and the lines hit a tree limb or other obstruction. Software cannot prevent faults.
Humans clearly have an important role to play in all of this. How quickly we recognize issues, and how quickly they are clearly communicated to the right people is very important. No matter how “smart” the grid becomes, humans will always play this important role.
User experience and system usability also plays an important role. If manually entering the line data into MISO’s state estimator had been an easier process, could that have changed anything? Maybe.
Then there’s the electrical engineering issues.
Outcomes of Blackout Events
The grid is a complex machine—maybe the biggest, most expensive, most complex machine ever built—and for the most part it lives out in the open, exposed to the elements.
A lot of engineering, design, and planning goes into this machine in order to keep it running properly.
One piece of equipment that grid engineers use to manage the grid are transmission line relays, or simply, relays. Relays are physical devices that monitor the power conditions, like current and voltage, and will open a breaker, severing power flow, if it detects an issue.
As investigations were being done into the blackout, it was discovered that some relays had operated unnecessarily. This meant that the power flowing through the lines was not actually outside of acceptable limits, but still, the relay opened the breaker and stopped power flow through the line. It was understood that these unnecessary operations of the relays contributed to the cascading nature of the blackout.
This was one of the most important findings of the 2003 blackout!
In the aftermath, the North American Electric Reliability Corporation (NERC) released new standards and regulations, meaning that grid operators like MISO would need to update their regional grids to meet these new standards.
NERC’s newly released reliability standards are known as Reliability Standard PRC-023 (Transmission Relay Loadability). Not the catchiest name, if you ask me. But in the document, they itemize some specific rules about when relays should and shouldn’t be operated, so as to not unnecessarily limit power flow.
It Is a Bit About Software
The unnecessary opening of breakers, and the new PRC-023 standards are a good example of how it’s not all about software.
But… It is a bit about software.
We’ve already talked about State Estimators and Real-Time Contingency Analysis (RTCA). Without these tools, the grid could not have grown to its current size, and complexity, while still maintaining its high degree of reliability.
Let’s continue on the topic of relays for just a bit longer. The rules set forth in NERC’s guidelines are very specific, and require that grid operators have a high degree of accuracy and control over their equipment. It can be difficult for grid operators to keep track of thousands, or hundreds of thousands of pieces of equipment, how much electricity can flow through them, their current status, and then compare that to the current state of the grid.
Adherence to the PRC-023 standards is especially difficult. You know what might help?
Software!
See—even when it’s not about software, it’s still about software. 🙂
Unless a grid operator has some sort of software solution to help them keep track of relay ratings, transmission line ratings, and relevant equipment ratings, they are in danger of not adhering to NERC guidelines (and paying a hefty fine!).
Conclusion
So there you have it—a full-circle journey from how a small software bug could contribute to a blackout affecting millions, to the instrumental role that software now plays in preventing similar disasters.
As we’ve seen, software’s importance extends far beyond just running our devices or powering our homes; it’s the invisible hand that manages our energy supply and demand, monitors the health of our power grids, and helps avert crises before they even happen.
This isn’t to say that software is the only player on the field, or that it’s without fault. Humans, weather events, and simple physics all play their part in this dance. But it’s clear that the role of software will only continue to grow as our power grid becomes more complex and interconnected.
In the wake of blackouts like the one on August 14, 2003, improvements to software have been instrumental in strengthening the reliability and resilience of our power grid. New tools, better algorithms, and greater connectivity are helping grid operators keep pace with the increasing demands of our power-hungry world.
So, next time you’re enjoying a cool breeze from your air conditioner on a sweltering summer day, make sure to spare a thought for the complex symphony of software and hardware, humans and machines, all working harmoniously to ensure that power continues to flow seamlessly.
Loved the article? Hated it? Didn’t even read it?
We’d love to hear from you.