

As the singularly focused business development person at Simple Thread, I greatly admire the work of the researchers, designers, and engineers I get to work with every day.
I also am deeply impressed by the product owners and subject matter experts we interface with at our partner organizations; they are so passionate about bringing digital products to life to solve their customers’ problems.
But with my skills I am always the generalist in the room. While I might be charged with fostering connections between new or existing clients and our teams, I am always the least knowledgeable person about whatever subject we happen to be talking about on a given day.
So how do I tread conceptual water during these conversations with award winning experts and industry leaders?
By using mental models!
Mental models help me diagnose problems, recognize patterns, and help teams who are searching for an answer that presently seems beyond their grasp. A mental model is a concept, framework, or pattern to help interpret the world and understand the relationship between things. For example, supply and demand helps to explain the price of a good based on its ubiquity or scarcity.
Our brains need mental models to help us make sense and quickly move through the world. The more patterns or challenges we can recognize and have ready models to apply, deconstruct, and re-assemble, the better products and businesses we can build.
Since I stopped trying to make ugly interfaces or compile bad code, here’s some of the mental models on which I have heavily relied over the last two decades to help diagnose and solve sticking points for our teams.
Human Factors Mental Models
Parkinson’s Law
Work expands to fill time
Cyril Northcote Parkinson observed that the British Foreign Office continued to expand in size even in the wake of the collapse of Britain’s colonial empire. To explain the phenomenon, Parkinson said that “work expands so as to fill the time available for its completion.” While this works on longer durations, the inverse is not always true. There are good ways to prevent and overcome Parkinson’s Law and most of them have to do with proper planning, setting realistic goals, and fostering an iterative culture.
Wikipedia: Parkinson’s Law
Atlassian: How to Overcome Parkinson’s Law
Parkinson’s Law of Triviality (Bikeshedding)
Focusing on complexity is hard
Humans have a tendency to misuse time on minor tasks while higher priorities are inadequately attended. This can happen personally (trivial emails over that important presentation) or in group projects. Why? Northcote posited that trivial items are easier to finish on a checklist or discuss in a group than complex topics or challenges.
Farnham Street: Why We Focus on Trivial Things: The Bikeshed Effect
Tech Target: Parkinson’s Law of Triviality (Bikeshedding)
Tim Urban: Inside the Mind of a Master Procrastinator
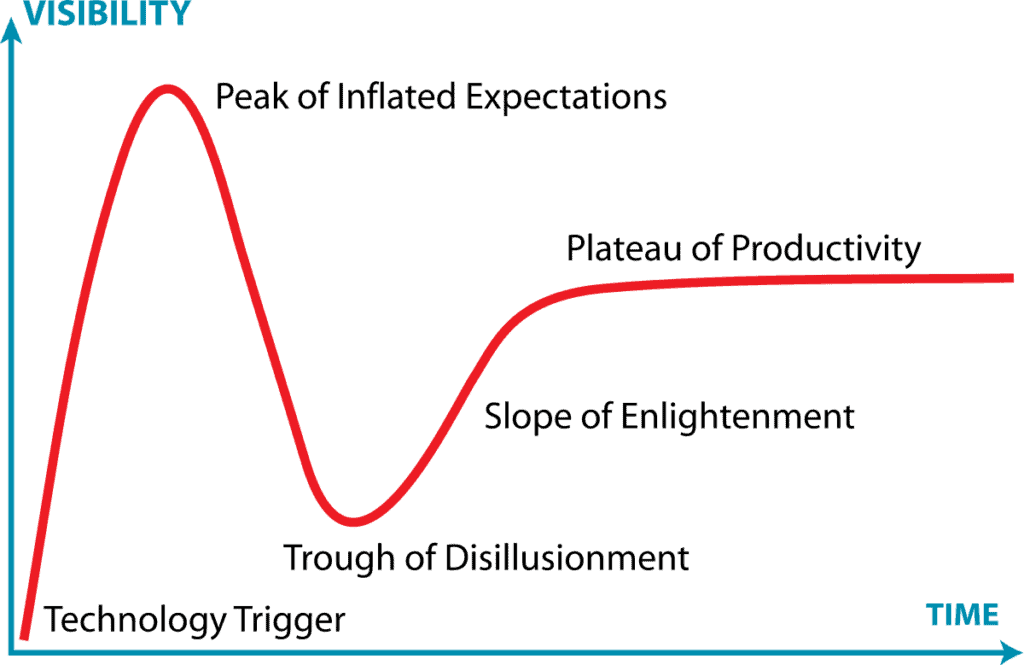
The Gartner Hype Cycle
What tech goes up …
When new technology comes along, humans tend to overreact in the short term benefits it offers. Proponents of the new tech cast it as a panacea which then sets the tech up to spark imaginations and create unfair expectations. Typically, the new tech is little more than lightly applied science and therefore fragile, or needs time for humans to understand how to harness it to change longstanding paradigms. The thought leaders at Gartner coined the term “The Hype Cycle” and graphed the concept. Typically expectations go very high before dropping drastically. This all proceeds to the long climb to actual utility of the tech is achieved broadly. For example, in September of 2022 NFTs are in the trough prior to their slower and more steady climb to actual utility.
Gartner: Gartner Hype Cycle Research
YouTube: The Gartner Hype Cycle Explained
Kanban
Visualize the work
Kanban is a popular workflow management method which defines, manages, and improves the delivery of knowledge work. Kanban literally means in Japanese “visual board” or “sign.” Simple cards/stickers sit in vertical columns representing 1) things to do, 2) things in process of being done, and 3) things that are done. This method helps prioritize and track tasks. The best thing about Kanban is that the spectrum between “to do” and “done” can be defined as you see fit with as many or few intermediate steps as make sense for your use.
Wikipedia: Kanban
Kanbanize: What Is Kanban? Explained for Beginners
The Law of Parsimony (Occam’s Razor)
The simplest solution is usually the answer
Occam’s Razor is that “entities should not be multiplied beyond necessity.” Practically this means to not make things more complex than they need to be. This can be applied broadly but there are lots of implications for business, managing people, and of course designing and building software products.
Wikipedia: Occam’s Razor
Simple Thread: Complexity in Software is Killing Us
Responsibility Assignment Matrix
Who’s responsible for what and when?
When things start falling through the cracks a lot (especially in cross-functional teams) it might be time to run a Responsible, Accountable, Consulted, Informed (RACI) diagram. RACI is a sound way to assign responsibilities and keep stakeholders engaged throughout the journey. RACI clarifies team members’ foci. If teams commit to RACI, ensuring it stays updated is vital to the long term success of keeping everything running smoothly.
Monday.com: What is the RACI Model?
The DPM: RACI Chart Template For Project Managers + Example & How-To
Product Management Mental Models
Jobs to Be Done
Focus on the problem, not the solution
Disruption theory can explain the phenomenon of how organizations attack incumbents or respond to the attacks of challengers, but it does nothing to explain where to innovate based on what customers want. This is where Clayton Christensen’s Jobs-to-be-done theory shines. As the adage goes “people don’t want to buy a quarter-inch drill bit, they want a quarter-inch hole.” What is the pain that you are experiencing from the lack of a quarter inch hole? What are the pains of would-be customers?
Harvard Business Review: Know Your Customers’ “Jobs to Be Done”
Christensen Institute: Jobs to be done
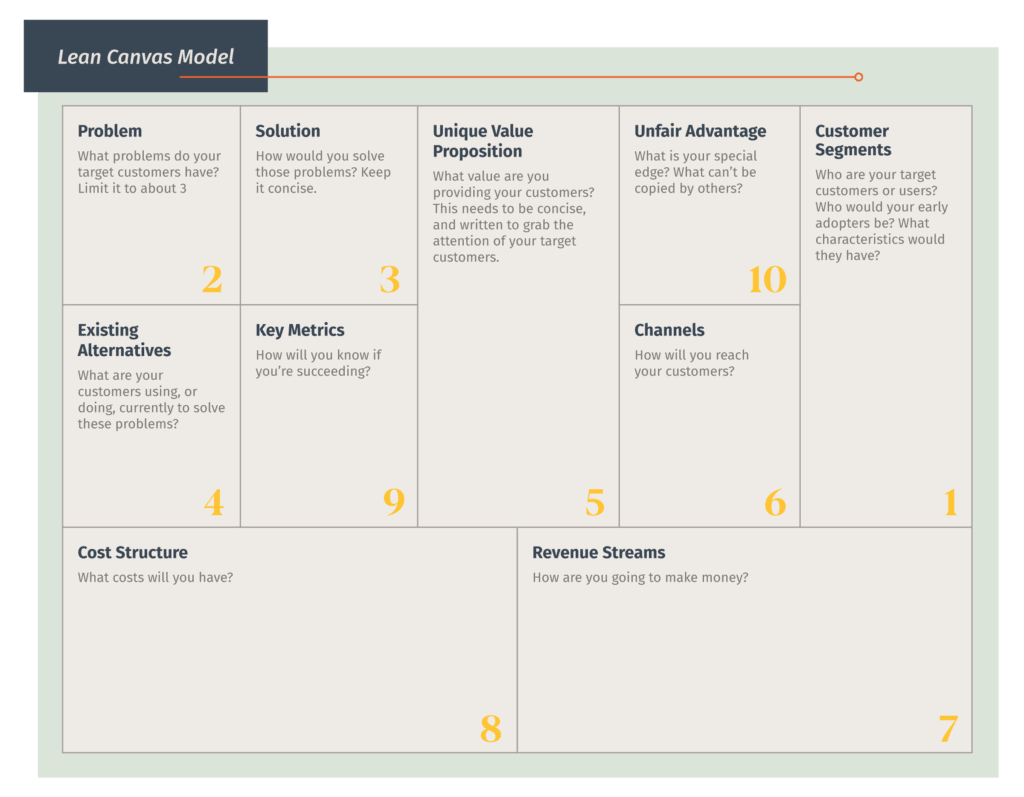
Lean Canvas Model
I have an idea … now what?
Products are born out of having an acute pain long enough that the only sensible solution is to build something to address it. Experiencing the pain and having an idea is a starting point, but what’s next? The Lean Canvas Model is an excellent framework that helps would-be builders step through the solution in a holistic sense of not just the product, but the customers, partners, and go-to-market strategies.
Wikipedia: Business Model Canvas
Matthias Orgler: How to Fill in the Business Model Canvas?
Walid AO: Business Model Canvas Explained — How to Use BMC For Your Next Big Idea
RICE Analysis
Better prioritization of features or projects
Which project is the most important? Which feature matters most? Without a framework to assign even some subjective values, it is hard to know where to start. Measuring potential projects or features by Reach, Impact, Confidence, and Effort (RICE) helps to provide some dimensions on how best determine where to begin.
Intercom: Simple prioritization for product managers
Roadmunk: A prioritization framework for estimating the value of ideas
The Kano Model
How can we delight our customers?
How can we measure satisfaction? Can we choose what to build to provide that satisfaction?
More importantly, how do we move past satisfaction into delight? There are no silver bullets to answer those questions, but researcher Noriaki Kano has given us a model to explore and discuss them.
Folding Burritos: The Complete Guide to the Kano Model
Wikipedia: The Kano Model
![]()
SWOT Analysis
Things are going fine, but now what?
If you have an established team, project, or business but also have a sneaking suspicion the group is not on the same page about what could lie ahead? A Strengths, Weaknesses, Opportunities, and Threats (SWOT) might be a worthwhile mental exercise.
SCORE: Your First Step Toward Business Growth: SWOT Analysis
Investopedia: SWOT Analysis: How To With Table and Example
System Design Mental Models
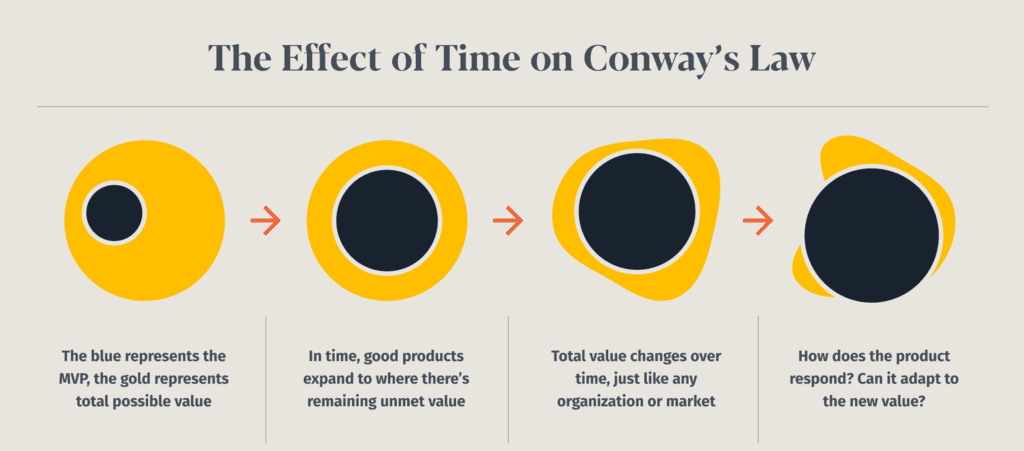
Conway’s Law
Design Imitates Life
Conway’s Law states that organizations will design systems that copy their communication structure. Some argue Conway’s Law is a blessing while others say it’s a curse. What’s most important is to be aware of it and use that knowledge to your own advantage when building software or the teams to support it.
Andrea Goulet: Want Better Code? Focus on Communication
Josh McKenty: Death to Conway’s Law
Matt Eland: Conway’s Law and Cross-Functional Teams
Distribution Law Mental Models
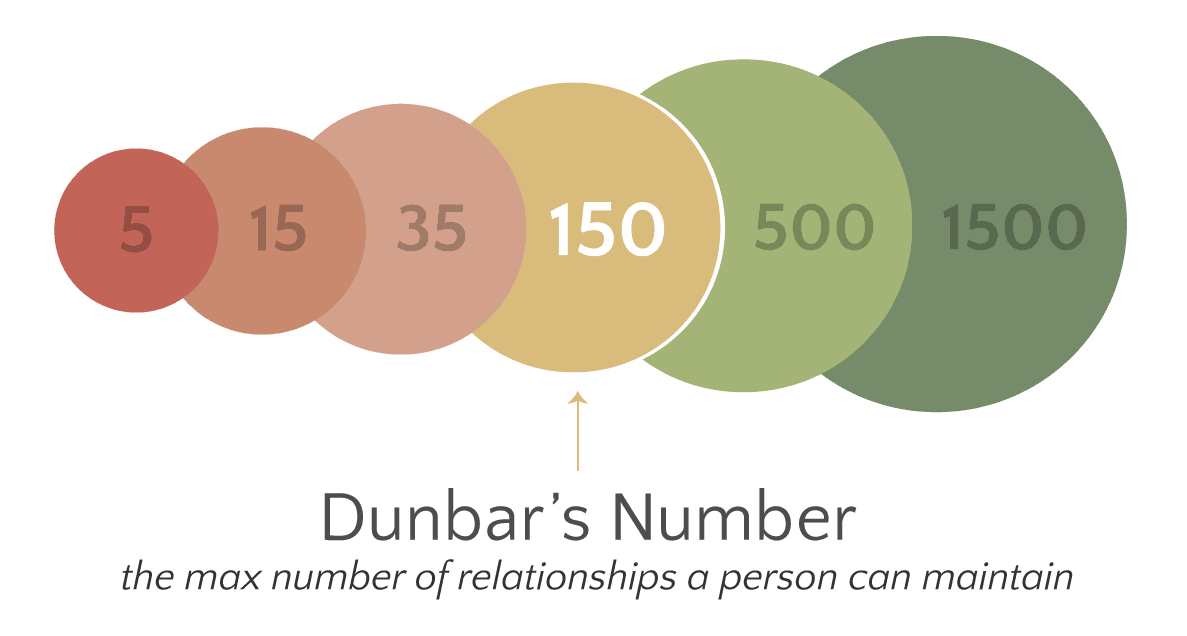
Dunbar’s Number
How big is too big for a team?
When do groups of people become too big and start to lose their effectiveness? Amazon calls it the “two pizza rule” but the foundational research was done by British anthropologist Robin Dunbar. Dunbar researched social group sizes of both primates and humans and concluded that based on the capacity of the brain’s neocortex some standard patterns of group sizes have persisted throughout human history. Five, 15, 35, and 150 seem to be the normal groupings which work for functional and social organizations. Beyond 150 is possible but push the limits of the ability to maintain functional relationships.
Wikipedia: Dunbar’s Number (Image by JelenaMrkovic, CC BY-SA 4.0)
The Stoa: Dunbar’s Number with Robin Dunbar
Normal Distribution (Bell Curve)
Emphasis to the expected average as opposed to the outliers
We all learned about bell curves in school. Given enough points of data (theoretically) it should tend toward a “normal” distribution with most points grouping to the middle with smaller frequencies of data points outlying the middle grouping. Understanding these normal distributions is helpful to understand that the more data leads to a more complete picture of the scenario and helps us think about running Monte Carlo style simulations and what results should look like.
Pareto Principle
Major on the major contributors
While bell curves represent ideal distribution, power laws tend to reflect the reality of work. For many outcomes, roughly 80% of consequences come from 20% of causes. This 20% is referred to as the “vital few.” Also called the 80/20 rule, the Pareto Principle is one common expression of a larger set of power laws. As applied to business this could manifest in many ways. Such as: the top 20% of clients represent 80% of revenue, fixing the top 20% of bugs in code solves 80% of users’ support incidents, 80% of web traffic comes from the top 20% of webpages, etc. This is important because it helps narrow problem solving techniques to addressing the vital few.
Dave Lavinksy: Pareto Principle: How To Use It To Dramatically Grow Your Business
Asana: Understanding the Pareto Principle
Harvard Business Review: We Need to Let Go of the Bell Curve
Conclusions
This is not gnosticism. There’s no special knowledge that you will now possess that will help you, especially, to achieve business nirvana. These are just patterns and practices that have been helpful to me in my career and I hope are helpful to you too.
What methods or mental models help you with your work? Care to share some in the comments?
Loved the article? Hated it? Didn’t even read it?
We’d love to hear from you.

